|
|
|||
| Product Design | My Artwork | Living Sustainably | |
| Art Engineering | Levitation Kit | Solar Power | Chevy Volt |
| About Me | Blog | Solar Heating | Thermal Windows |
| Contact | Solar Hot Water | Solar Mower | |
|
|
|||
| Product Design | My Artwork | Living Sustainably | |
| Art Engineering | Levitation Kit | Solar Power | Chevy Volt |
| About Me | Blog | Solar Heating | Thermal Windows |
| Contact | Solar Hot Water | Solar Mower | |
home > solar DHW
Installing My Solar
Domestic Hot Water
Heating System
|
Click below to jump to
specific pages
|
|||||||||||||
| HOME |
Receiving parts |
Design tweaks |
Installing staging |
Installing collectors |
Planning plumbing |
Pulling umbilical |
Plumbing tank |
Installing Wand |
Test Results |
Dash board |
Check valve |
Adding HX |
LIVE STATS |
|
|
|
|
|
|
|
|
|
|
|
|
|
|
|
A "dashboard" in the kitchen
| August 22, 2006
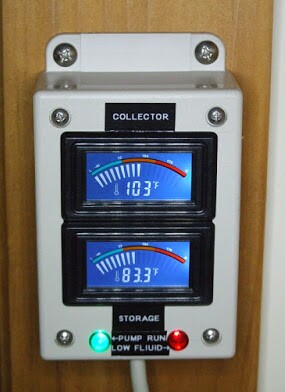
But seriously, when I tire of logging data I will need a conveniently located basic system monitor, or a "dashboard" if you will. So I put a dual display up next to the kitchen sink which is right above the water heater in the basement. This unit displays the collector temperature (from the pipe as it enters the Solar Wand just above the tank) and the temperature at the top of the tank. There are 2 lights, a green one indicates the pump circulation, and a flashing red one that warns of low fluid in the overflow reservoir above the collectors. August 2009 update:
December 2010 update: |
 A note to anyone with electronics experience. The
displays are digital voltmeters that are connected to LM34CZ temperature
to voltage sensors. The sensors produce a signal with 1mV/degree
F. So .85 Volts represents 85F. Neat! Check the
page 7 of the data
sheet LM34CZ to learn how to attach it to a long inductive wire (I
used microphone cable). A note to anyone with electronics experience. The
displays are digital voltmeters that are connected to LM34CZ temperature
to voltage sensors. The sensors produce a signal with 1mV/degree
F. So .85 Volts represents 85F. Neat! Check the
page 7 of the data
sheet LM34CZ to learn how to attach it to a long inductive wire (I
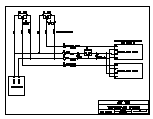
used microphone cable).Click the image at left to see a schematic for the whole dashboard. |
  I
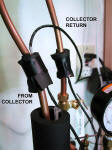
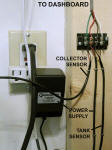
tucked the collector sensor under a piece of insulation wrapped around the
tube that enters the Solar Wand, and the tank sensor I poked deep under
the tank insulation at the top of the tank. All the wires connect to
a terminal strip on the back wall. The sensors and meters are
powered by a wall transformer that provides 12 Volts at 100mA. I
tucked the collector sensor under a piece of insulation wrapped around the
tube that enters the Solar Wand, and the tank sensor I poked deep under
the tank insulation at the top of the tank. All the wires connect to
a terminal strip on the back wall. The sensors and meters are
powered by a wall transformer that provides 12 Volts at 100mA.At some point in the future I might even build a graphical display that shows the readings for the last 24 hours. |
 June 2016 update: I updated my dashboard with more contemporary styled displays that I found on the web for under five dollars each. Click here to read my blog post about this updated display. |